U.S. Department of Transportation, Climate Change Center
Decarbonization Strategies Playbook
Active Transportation
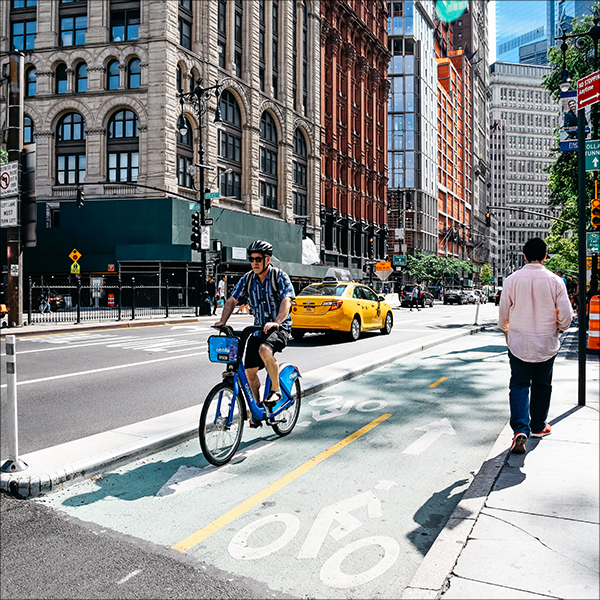

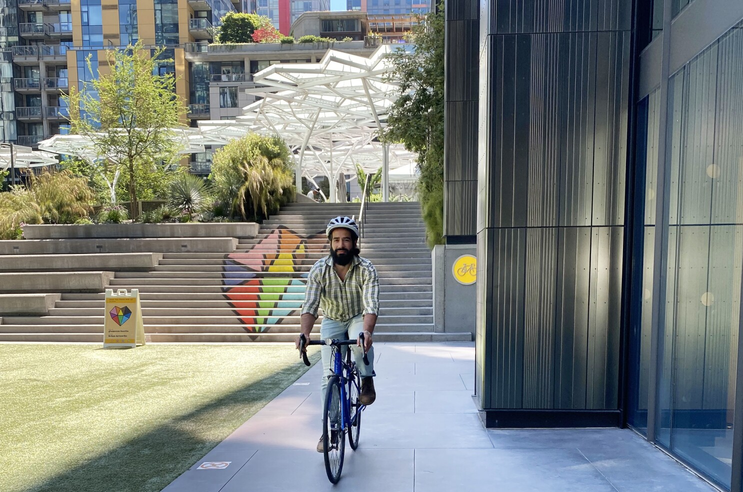
Safe, comfortable, and continuous active transportation networks seamlessly connect people to places, foster healthier communities, and reduce reliance on carbon-intensive modes of travel.
Also known as
Nonmotorized travel, Bike/pedestrian, or micromobility
U.S. DOT, Climate Change Center
Decarbonization Playbook
Table of Contents
3
Overview
4
GHG Reduction Potential
5
Co-Benefits
Implementing Active Transportation: What to Read Next
6
7
Cost Considerations
8
Funding Opportunities
9
Complementary Strategies
10
Resources
11
References
Overview
Best Suited for:
Large scale & small scale; Long term & short term; Urban, suburban & rural
Walking, biking, and rolling—collectively known as active transportation or micromobility—are fundamental elements of sustainable, connected, and vibrant communities. Nearly every trip involves an active transportation element, from walking to a bus stop to cycling the final stretch to work. This inherent connection to daily travel is underscored by recent data from Bureau of Transportation Statistics: in 2021, over half (52%) of all trips in the U.S. were less than three miles – suitable for a twenty-minute bike ride; and a significant portion (28%) of trips less than one mile. When we consider that most people are comfortable walking up to half a mile and cycling up to two and a half miles for everyday trips, the potential for active transportation to significantly reduce greenhouse gas emissions becomes readily apparent.
Did you know?
U.S. DOT’s Strategic Plan for 2022-2026 sets a mode shift target to increase the percentage of person trips by transit and active transportation modes by 50%.
Investments in well-designed, inclusive active transportation infrastructure and programs unlock benefits beyond environmental gains. These networks create a more engaging, affordable, and convenient travel experience, while helping to ensure people are connected to the outdoors and the essential places they need to go each day. Electric micromobility options, like e-bikes and e-scooters, extend the reach of active transportation – they allow slightly longer distances to become feasible for some users, further reducing reliance on cars. Additionally, active transportation serves as a valuable extension of public transit, by closing first- and last-mile gaps for riders. These networks can also play a role in more sustainable and efficient urban freight delivery. They help cargo bikes and other micromobility devices navigate urban areas with greater ease, reducing the need for delivery trucks. With more people walking and cycling, streets become more vibrant and inviting, cultivating a sense of community and foot traffic for local businesses.
Overview
A safe and accessible active transportation network goes beyond just physical infrastructure. Elements of bicycle and pedestrian infrastructure and supportive programs may include:
Infrastructure for Bike/Scooters/Other Micromobility Devices
- Protected or shared bike lanes
- Separation/buffers
- Intersection treatments for bicycles (bicycle boxes, stop bars, lead signal indicators)
- Wayfinding and Signage
- Secure parking and storage facilities
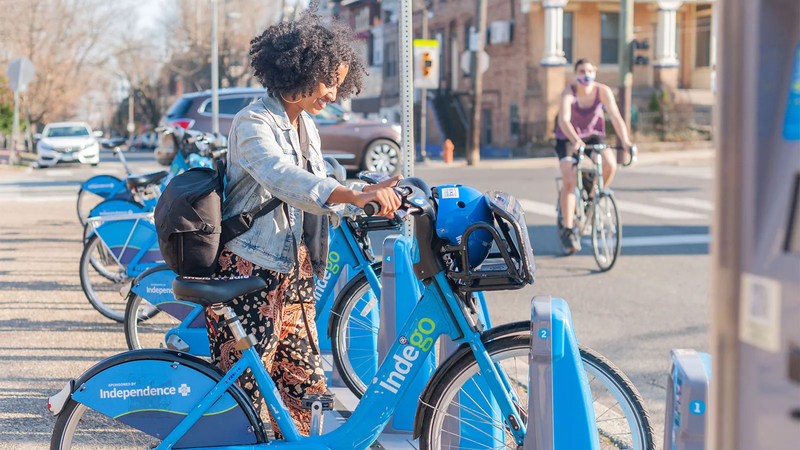
- Bike Share Programs
- Bike Repair/Tool Stations
- Bike Rebates and Tax Credits
- Bike Schools, Bike Ambassadors and Capacity Building
- Community Rides
Shared Infrastructure
- Lighting
- Bicycle/pedestrian bridges
- Workplace or destination-based facilities / supportive infrastructure (lockers, changing facilities, secure parking)
- Traffic calming
- Integration with Transit
Infrastructure for Pedestrians
- Landscaping, Street Furniture, and Shade
- Quality, continuous, wide sidewalks
- Signalized, high visibility pedestrian crossings with Audible and Visual Countdowns
- Mid-block/refugee islands
Supporting Public Policy
- Land-use regulation to encourage pedestrian-oriented infrastructure
- Micromobility parking standards
GHG Reduction Potential
Active transportation is more efficient than other options
Passenger vehicles produce approximately 0.95 lbs. of CO2 per passenger-mile compared to 0.05 lbs. of CO2 per passenger-mile emitted by biking (European Cycling Federation 2016).
This study considered not just the emissions from the vehicles themselves, but from the entire fuel and vehicle lifecycle including production, maintenance, and fuel.
Benefits from a Comprehensive Approach
A study by Cambridge Systematics Inc. estimated comprehensive bicycle and pedestrian improvements implemented between 2010 and 2025 across U.S. metropolitan areas could reduce GHG emissions by 2.2 to 6.6 million metric tons of CO2e in 2030. The exact reduction depends on the scope of the improvements (U.S. Department of Transportation 2010).
Note: For reference, passenger vehicles emitted 365 million metric tons in 2021 ( EPA 2023 ).
Benefits from Specific Strategies
Provide Pedestrian Network Improvements: A study by the California Air Pollution Control Officers Association (CAPCOA) estimates that increasing sidewalk coverage to improve pedestrian access can reduce GHG emissions from vehicle travel by 6.4% (CAPCOA 2021).
Bikeshare Program: A study quantifying the environmental benefits from bike share trips across different metropolitan bike share systems estimated the annual reduction in 2016 in Seattle to be 41 tons of CO2e, and as large as 5,417 tons of CO2e in New York City (Kou and Wang 2020).
GHG Reduction Potential
Road Modifications: Road modifications or diets, which reconfigure streets to allocate more space for pedestrians and cyclists, can contribute to GHG reductions. A road diet project in Davis, California resulted in an estimated reduction of 24.4 metric tons of CO2e over a 12-year period. Before the road diet, the 0.8-mile segment had four vehicle lanes. After, the road makeup consisted of two vehicle lanes, a bike lane on other side, and an isolation strip in between (California Climate Investments Quantification Methods Assessment 2019). Note, the City of Davis has a population of about 68,000 and many of its residents study and work at the University of California, Davis (UC Davis).
Annual GHG and VMT Reductions from Mode Shift:
Even seemingly small changes can have a significant impact on GHG emissions. Studies show that if residents in a city of 50,000 people switched just one mile of their daily trips from driving to active transportation, this change could result in a collective reduction of 10.14 million pounds (5,070 tons) of CO2 per year and nearly 400,000 fewer miles driven (U.S. Department of Housing and Urban Development 2016).
Cobenefits
Safety
- Investments in and the expansion of active transportation infrastructure are proven safety countermeasures promoted by FHWA for reducing roadway fatalities and serious injuries.
- Investment in active transportation can promote the perception and reality of safety. A higher volume of people walking and cycling fosters a stronger sense of community and contributes to more “eyes on the street” (University of Colorado Denver, 2014).
- Communities designed with pedestrians, bicyclists, and other micromobility users in mind can reduce the incidence of collisions, injuries, and fatalities on shared roadways. Safer streets and connecting trails can, in turn, encourage further shifts towards active transportation (Bas et al., 2023).
Cost Savings
- Owning and operating a bicycle is considerably cheaper than owning and operating a car, freeing up resources for other essential needs for individuals and families. Owning and operating a bicycle typically costs around $3.00 per 100km (62 miles) traveled while a private car can be six times more expensive, at approximately $18.00 per 100km. This includes factors like purchase price, maintenance, fuel, and insurance (ITDP 2021).
See other FHWA Safety Countermeasures here:
https://highways.dot.gov/safety/proven-safety-countermeasures
Economic Growth
Investments in well-designed, inclusive active transportation infrastructure and programs unlock benefits beyond environmental gains. These networks create a more engaging, affordable, and convenient travel experience, while helping to ensure people are connected to the outdoors and the essential places they need to go each day. Electric micromobility options, like e-bikes and e-scooters, extend the reach of active transportation – they allow slightly longer distances to become feasible for some users, further reducing reliance on cars. Additionally, active transportation serves as a valuable extension of public transit, by closing first- and last-mile gaps for riders. These networks can also play a role in more sustainable and efficient urban freight delivery. They help cargo bikes and other micromobility devices navigate urban areas with greater ease, reducing the need for delivery trucks. With more people walking and cycling, streets become more vibrant and inviting, cultivating a sense of community and foot traffic for local businesses.
Cobenefits
Accessibility and Equity
By reducing reliance on cars, prioritizing safety, and fostering connections, active transportation creates a more equitable and accessible transportation system that benefits all members of the community. This is achieved through inclusive infrastructure planning and design that caters to a variety of abilities and experiences (FHWA 2023).
Robust active transportation provides a reliable and flexible options for individuals commuting outside of ‘9 to 5’ working hours when public transit services may not be operating.
Active transportation is linked to decreased loneliness, increased access to family and friends, and greater levels of socialization (Williams et al. n.d.).
A survey conducted by Victoria Transport Policy Institute reveals people are more likely to have a friendly social interaction when walking or biking than when traveling by private automobile (Victoria Transport Policy Institute, 2023).
Air Quality and Health
A benefit cost analysis analyzing bicycle improvements in Portland, Oregon indicates that by 2040, $138 to $605 million in total investments will provide $388 to $594 million in estimated healthcare benefits (Gotschi 2011).
Resilience and Adaptation
Active transportation infrastructure can bolster a community's resilience during crises. For instance, during the 2020 COVID-19 pandemic, cycling offered a safe and reliable mode of transportation for many.
Rural Communities
Residents of low-density areas, especially in rural settings, are less likely to have access to safe infrastructure to walk. Yet, rural residents walk to their destinations almost as often as urban residents and are less likely to have a variety of modes to choose from. This lack of infrastructure causes higher rates of death and injury, especially in Tribal communities. Rural communities can build recreational bike and pedestrian trails which often have dual use as commuter routes for some trips.
Reducing the number of emissions-emitting vehicles on the road (especially in densely populated areas) will decrease air pollutants that are harmful to human health.
Integrating active travel into daily routines promotes physical well-being and stress reduction; 3 hours of biking per week can reduce a person's risk of heart disease by 50%.
Implementing Active Transportation: What to Read Next
There is comprehensive guidance available on creating safe, efficient, and inclusive active transportation networks from design standards, engagement strategies, and proven methods for overcoming strategies.
Several sources are summarized under Guidance Documents in the Resources section below. More detail can also be found on the USDOT’s Active Transportation page or FHWA’s Bicycle and Pedestrian Program page.
Inclusive infrastructure planning and design that prioritizes safety and caters to a variety of experiences and abilities is key to encouraging broader participation in active transportation.
Implementing subsidies and offering bike-share programs can reduce upfront costs for users. Bike-sharing, in particular, offers offers a low-commitment option that can be less intimidating than purchasing a bike outright, especially for first-time riders. Targeted programs like cycling education can equip users with the skills and confidence they need to navigate the streets safely. Several States have implemented subsidy programs, including Colorado:.
Read about Colorado’s tax credit and rebate program, here: https://energyoffice.colorado.gov/ebike-tax-credit
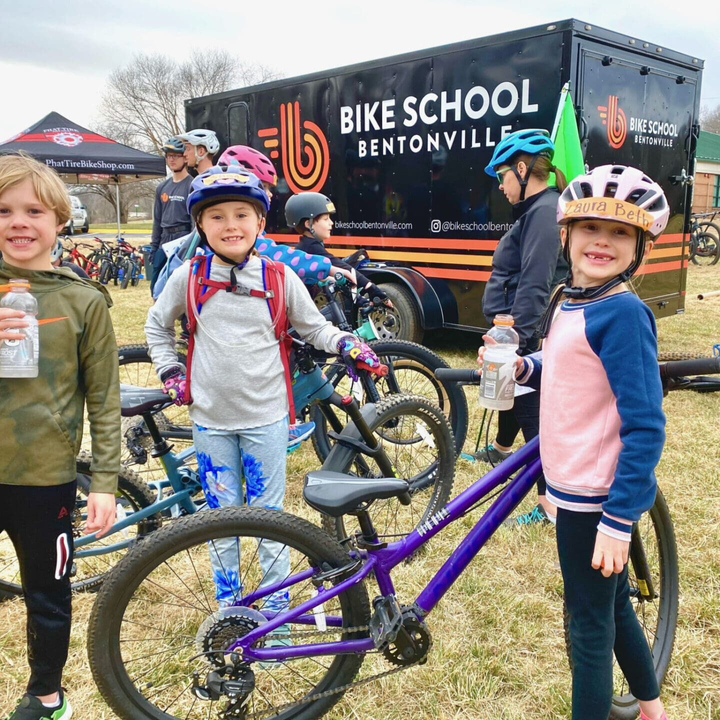
Lack of knowledge or confidence in riding a bicycle can pose significant barriers to active transportation. Targeted outreach and culturally sensitive programming can play a vital role in closing this gap.
Read about Fort Collin’s Targeted Bike Programs, including a Bike School, here: https://bikefortcollins.org/videos-highlight-active-living-program-efforts/
Implementing Active Transportation: What to Read Next
Other inclusive design elements may include incorporating universally understood signage for people with varying English proficiency, bike share systems that offer adaptive bikes, or bike facilities that support a wide range of user needs, such as providing lockers for users who trip chain.
Active transportation that is well integrated with transit facilities can allow for seamless connections and address first and last-mile gaps. When connections are safe, comfortable, easy to navigate, and engaging, they become a natural extension of public transit. Investments in infrastructure like secure bike lockers at transit stations, bike repair facilities, and designated areas for storing foldable bikes, also contribute to a more convenient and user-friendly experience for active commuters.
Read more about safety considerations when connecting to transit here: FHWA and FTA’s Guidebook on Improving Safety for Pedestrians and Bicyclists Accessing Transit.
Cost Considerations
Cost of Implementation
The cost to implement active transportation projects varies widely depending on the scale, scope, and location of the project.
Active transportation infrastructure has lower installation and maintenance costs compared to other modes:
- Roadways cost upwards of $1 million/lane km (Institute for Transportation Development and Policy 2022).
- Metros (heavy rail) cost at least $50 million/km (Flyvbjerg and Bruzelius 2008).
- Bus rapid transit projects cost at least $700,000/lane km (Institute for Transportation Development and Policy 2007).
- In contrast, bike lanes can range from a few thousand dollars per mile for simple signage to $500,000 for more elaborate, off-street paths. Similarly, pedestrian improvements can be as low as a few thousand dollars for crosswalks and traffic calming measures.
Cost Effectiveness
- A DOT Report to Congress estimates that an annual federal investment in bicycle and pedestrian facilities of approximately $760 million to $3 billion equates to a $80 to $210 cost per ton of CO2e reduced, and a net savings of $600 to $700 per ton (U.S. Department of Transportation 2010).
- Compared to other decarbonization strategies, active transportation offers a compelling value proposition.
- Ride matching, Carpool, and Vanpool: $80 per ton of CO2e reduced
- Intercity Tolls: $500 to $800 per ton of CO2e reduced
- Traffic Management: $40 to $2000 per ton of CO2e reduced
Bike lanes were found to cost as little as $5,000 per mile for signing and striping only, or up to $50,000 per mile for designing a roadway with additional width to accommodate a lane. Conversion of minor streets to “bicycle boulevards” was estimated to cost $250,000 to $500,000 per mile. Construction of an off-street shared-use path ranges from $500,000 to as high as $2 million per mile. These costs can be compared with typical local road construction costs of about $2 million per mile (Burchell et al., 2002).
Similarly, pedestrian improvements can be as little as $1,000 for a painted and signed crosswalk to in the range of $10,000 to $20,000 for a traffic calming device; while sidewalk construction may range from $200,000 to $800,000 per mile (U.S. Department of Transportation 2010).
Funding Opportunities
FHWA compiles pedestrian and bicycle activities and their likely eligibility under U.S. Department of Transportation surface transportation funding programs in the following table: https://www.fhwa.dot.gov/environment/bicycle_pedestrian/funding/funding_opportunities.pdf
FHWA's Active Transportation Infrastructure Investment Program (ATIIP) funds projects to provide safe and connected active transportation in active transportation networks or active transportation spines. Improvements in active transportation networks under ATIIP will expand and improve active transportation and promote it as a low-carbon transportation option.
USDOT’s Safe Streets and Roads for All (SS4A) Grant Program was established by BIL to support regional, local, and Tribal initiatives to prevent roadway deaths and serious injuries through the safe system approach. Similar to the Zero Deaths and Safe System Program, safety improvements from SS4A will encourage mode shift by removing safety barriers to active transportation.
FHWA’s Surface Transportation Block Grant (STBG) Program provides funding to States for a wide variety of transportation infrastructure projects, including active transportation projects. Federal law requires 10 percent of these funds to be set aside for Transportation Alternatives, which include a variety of smaller-scale transportation projects like pedestrian and bicycle facilities. There is a further set aside for the Recreational Trails Program, which provides funds to develop and maintain recreational trails and trail-related facilities for both nonmotorized and motorized recreational trail uses.
FHWA's Congestion Mitigation and Air Quality Improvement (CMAQ) Program supports surface transportation projects and other related efforts that contribute air quality improvements and provide congestion relief. The BIL continues the CMAQ Program to provide a flexible funding source to State and local governments for transportation projects and programs to help meet the requirements of the Clean Air Act, including pedestrian, bicycle, and shared micromobility facilities and programs.
USDOT’s Reconnecting Communities and Neighborhoods (RCN) Program provides grants to improve multimodal transportation access, to foster equitable development, and to remove, retrofit, or mitigate highways or other transportation facilities that create barriers to community connectivity. Projects that improve walkability, safety, and affordable transportation access are eligible for funding. An example of how Reconnecting Communities is improving active transportation access, mobility, and community livability can be found in the Reconnecting Communities Story Map feature of Buffalo, New York, https://storymaps.arcgis.com/stories/dc61e3bcecd44464b4bfef8299d9d6ce
HUD's Community Development Block (CDBG) Program supports community development activities to build stronger and more resilient communities. Activities may address needs such as infrastructure, economic development projects, public facilities installation, community centers, housing rehabilitation, public services, clearance/acquisition, microenterprise assistance, code enforcement, homeowner assistance, etc.
Complementary Strategies
TOD can encourage active transportation by creating compact, mixed use neighborhoods with pedestrian-friendly streetscapes and bike infrastructure. Active transportation infrastructure can enhance the accessibility and attractiveness of TOD by providing residents and visitors with safe and convenient options to access transit hubs and navigate the surrounding area. TOD and active transportation infrastructure work together to promote sustainable mobility and reduce GHG emissions.
Shared micromobility services, such as bike and scooter-sharing programs, complement active transportation networks by offering convenient, low-barrier options for short-distance trips, thereby encouraging individuals to choose sustainable modes of transportation and reducing reliance on private vehicles.
Micromobility delivery services rely on the infrastructure established within active transportation networks. Leveraging bicycles and scooters for last-mile deliveries, these services contribute to the efficient movement of goods while complementing efforts to reduce traffic congestion and emissions in urban areas.
Employers can create a culture that embraces active transportation by offering commuter benefits and building infrastructure that makes walking and cycling to work a safe and convenient option.
Complementary Strategies
Zoning plays a key role in promoting active transportation by shaping the built environment. Zoning codes can influence the design and layout of neighborhoods, including the provision of sidewalks, bike lanes, and pedestrian-friendly infrastructure. By incorporating mixed land uses, reducing distances between destinations, and prioritizing bikeability and walkability, zoning can encourage and support active transportation options such as walking and biking. Additionally, zoning reforms may be needed to accommodate amenities like bike-sharing programs and pedestrian-oriented streetscapes, further promoting active transportation within communities.
Induced demand modeling can be used to consider how the addition of active transportation infrastructure influences overall transportation patterns. Providing safe and accessible active transportation infrastructure can contribute to a shift in travel behavior, which may influence induced demand patterns by reducing reliance on personal vehicles, particularly for short-distance trips. This information can help justify investments in active transportation infrastructure and guide the allocation of resources to maximize the benefits of these projects.
Coordinated Transportation Planning:
Coordinated transportation planning complements active transportation when it leads to compact, mixed-use development where destinations are convenient, accessible, and support the development and use of active transportation infrastructure. Conversely, active transportation infrastructure can help achieve coordinated transportation planning goals by making walking and biking safer, more accessible, and convenient.

Case studies


350 T
CO2 Emissions Saved
12
Jobs Generated

$80M
Economic Activity
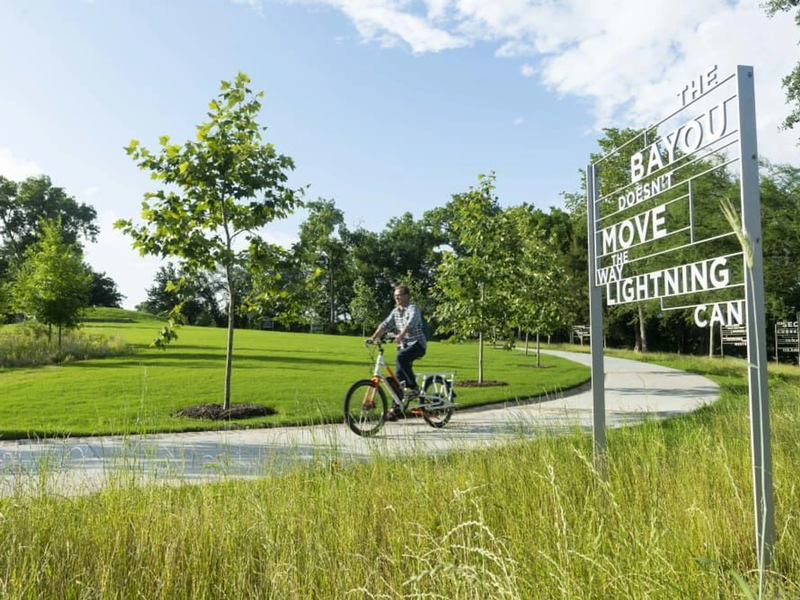
The Greenway in Houston has reduced reliance on cars, avoiding an estimated 117,000 trips annually and saving 350 tonnes of CO2 emissions. This shift towards cycling not only benefits the environment but also creates jobs – the Greenway is projected to generate 12 jobs per year for the next 25 years – and fosters economic activity, with potential annual benefits exceeding $80 million when considering a city-wide 2% cycling mode share.
Case studies
Launched in 2018, Puerto Rico's Complete Streets Plan prioritizes safety and accessibility for all travelers. The plan and accompanying design guidelines were developed under three main objectives. First, the guidelines emphasize use of infrastructure to improve people’s quality of life. Second, the guidelines include tools to enhance pedestrians and cyclist access to the transit system. Finally, they define components to create accessible infrastructure that is inclusive to every population group despite its individual characteristics such as age or physical conditions. The Complete Streets guidelines are expected to improve air quality, reduce congestion, and foster economic growth through more connected and vibrant places.
In a bid to reduce employee drive-alone rates, Amazon fosters active transportation through their MyCommute program. Employees enjoy a $170 monthly subsidy for various options including e-bike leases, bike maintenance, and public transit. Amazon has also invested in bike infrastructure at its Seattle campuses with 3,000 bike stalls, dedicated e-bike charging stations, and on-site bike maintenance partnerships. The company’s focus on active commuting has demonstrably reduced reliance on cars, contributing to a more sustainable work environment.
Resources
General Resources
It’s Transportation for All of Us (ITS4US) Complete Trips: This federal initiative focuses on creating a transportation system that is accessible and equitable for everyone. It prioritizes the needs of pedestrians and cyclists, making it easier and safer for people to choose active transportation options.
The Alliance for Biking and Walking Resource Library: This extensive online library offers hundreds of resources on bicycling and walking, including research, data, educational materials, and best practices.
Guidance Documents
FHWA Guidance: Bicycle and Pedestrian Planning, Program, and Project Development: This comprehensive guide offers a detailed framework for planning, designing, and implementing bicycle and pedestrian infrastructure projects.
FHWA Guidebook Measuring Multimodal Network Connectivity: This guidebook outlines five core components of multimodal network connectivity: Network completeness, Network Density, Route directness, Access to destinations, Network quality. While these components are all related, the distinctions between them provide a framework for selecting connectivity measures that address specific questions. The guidebook describes analysis methods and supporting measures associated with each of these components.
U.S. Department of Housing and Urban Development, Creating Walkable and Bikeable Communities: This guide provides practical information and strategies for communities to plan, design, and implement improvements that promote walking and cycling.
National Association of City Transportation (NACTO) Urban Bikeway Design Guide: This is a leading resource for designing safe and efficient bicycle infrastructure that accommodates cyclists of all ages and abilities.
FHWA A Resident’s Guide for Creating Safer Communities for Walking and Biking: This guide empowers residents to advocate for and participate in efforts to create safer streets for walking and cycling.
FHWA Pedestrian Lighting Primer, April 2022: This guide provides information on best practices for pedestrian lighting, ensuring safe and comfortable walking environments at night.
Association of Pedestrian & Bicycle Professionals’ Essentials of Bike Parking: Selecting and Installing Bike Parking that Works: This resource offers guidance on selecting and installing bike parking facilities that meet the needs of cyclists and encourage bike use.
Resources
Toolkits and Modelling Approaches
FHWA Congestion Mitigation and Air Quality Improvement (CMAQ) Calculator Toolkit, Bicycle, Pedestrian, and Shared Micromobility Tool: The CMAQ Toolkit includes a tool specifically designed to estimate the air quality and greenhouse gas reduction benefits of bicycle, pedestrian, and shared micromobility infrastructure projects.
FHWA Active Transportation Funding and Finance Toolkit: https://www.fhwa.dot.gov/environment/bicycle_pedestrian/resources/atfft/This toolkit provides information about various funding sources and financing mechanisms that can be used to support active transportation projects.
C40 Knowledge Hub, Walking and Cycling Benefits Tool: This online tool allows users to estimate the potential health, economic, and environmental benefits of investments in walking and cycling infrastructure.
World Health Organization, Health Economic Assessment Tool (HEAT) for Walking and Cycling: This tool helps assess the health benefits associated with increased walking and cycling, including potential reductions in healthcare costs.
United Nations Environment Program Cost Benefit Analysis of NMT Infrastructure Projects: This resource provides guidance on conducting cost-benefit analyses for non-motorized transport (NMT) infrastructure projects, including walking and cycling facilities.
Smart Growth, Complete Streets Policy Evaluation Tool: This tool quantifies the Smart Growth Complete Streets Policy Framework and can help identify policy strengths, as well as areas where the policy can be improved.
FHWA, My Street Planning Tool for Improving Pedestrian Safety: My Street is a sketch-level planning tool designed to help users explore options for improving pedestrian safety in their project area.
Mobility Energy Productivity Tool (MEP): This tool evaluates the ability of a transportation system to connect individuals to goods, services, employment opportunities, and others while accounting for time, cost, and energy.
Working with Communities
U.S. Department of Energy’s, Clean Cities Coalition Network: This network supports communities in achieving cleaner air and reducing dependence on fossil fuels by promoting alternative transportation options.
FHWA’s Zero Deaths and Safe System Program: This program provides resources and guidance to help communities eliminate traffic fatalities and serious injuries. Active transportation is a key component of the Safe System approach, promoting safer streets for pedestrians, cyclists, and motorists.
EPA’s Smart Growth: This website provides resources and technical assistance to help communities integrate active transportation into their development plans, promoting compact, walkable neighborhoods.
References
Bas, Al-Khasawneh, Erdoğan, Cirillo, (2023). How the design of Complete Streets affects mode choice: Understanding the behavioral responses to the level of traffic stress, Transportation Research Part A: Policy and Practice, Volume 173. https://www.sciencedirect.com/science/article/pii/S0965856423001180
California Air Pollution Control Officers Association (CAPCOA), (2021). Handbook for Analyzing Greenhouse Gas Emission Reductions, Assessing Climate Vulnerabilities, and Advancing Health and Equity (GHG Handbook). Available at https://www.airquality.org/ClimateChange/Documents/Handbook%20Public%20Draft_2021-Aug.pdf
California Climate Investments Quantification Methods Assessment, (2019). Quantifying Reductions in Vehicle Miles Traveled from New Bike Paths, Lanes, and Cycle Tracks, https://ww2.arb.ca.gov/sites/default/files/auction-proceeds/bicycle_facilities_technical_041519.pdf
European Cycling Federation, (2016). Cycle more Often 2 cool down the planet - Quantifying CO2 savings of cycling. https://ecf.com/groups/cycle-more-often-2-cool-down-planet-quantifying-co2-savings-cycling
Federal Highway Administration, (2023). Integrating Equity into Transportation: An Overview of USDOT Efforts. https://highways.dot.gov/public-roads/spring-2023/05
Flyvbjerg, Bent, & Bruzelius, Niels. (2008). Comparison of Capital Costs per Route-Kilometre in Urban Rail. https://www.researchgate.net/publication/27345875_Comparison_of_Capital_Costs_per_Route-Kilometre_in_Urban_Rail
Gotschi, (2011). Costs and Benefits of Bicycling Investments in Portland, Oregon, Journal of Physical Activity and Health, Vol. 8, Supplement 1, pp. S49-S58; at https://bit.ly/3bHRhx2. https://doi.org/10.1123/jpah.8.s1.s49
I
nstitute for Transportation Development and Policy, (2007). BRT Planning Guide Sample Operator Contract and Infrastructure Cost Calculator. https://www.itdp.org/2007/06/01/brt-planning-guide-sample-operator-contract-and-infrastructure-cost-calculator/
Institute for Transportation Development and Policy, (2021). The Compact City Scenario – Electrified. https://www.itdp.org/publication/the-compact-city-scenario-electrified/
Institute for Transportation Development and Policy, (June 2022). Making the Economic Case for Cycling. https://itdp.org/publication/economics-of-cycling/
International Energy Agency, (2020). Employment multipliers for investment in the transport sector. https://www.iea.org/data-and-statistics/charts/employment-multipliers-for-investment-in-the-transport-sector
References
Kou, Wang, Chiu, and Cai (2020). Quantifying greenhouse gas emissions reduction from bike share systems: a model considering real-world trips and transportation mode choice patterns, Resources, Conservation and Recycling, Volume 153, ISSN 0921-3449, https://doi.org/10.1016/j.resconrec.2019.104534
Maizlish and Woodcock, (2013). https://www.ncbi.nlm.nih.gov/pmc/articles/PMC3673232/Health Cobenefits and Transportation-Related Reductions in Greenhouse Gas Emissions in the San Francisco Bay Area. https://www.ncbi.nlm.nih.gov/pmc/articles/PMC3673232/
Smart Growth America, (March 2015). Safer Streets, Stronger Economies Complete Streets project outcomes from across the country. https://smartgrowthamerica.org/wp-content/uploads/2016/08/safer-streets-stronger-economies.pdf.
University of Colorado Denver, (June, 2014). More bicyclists on road means fewer collisions. https://www.sciencedaily.com/releases/2014/06/140624093328.htm
U.S. Department of Energy, Office of Energy, Efficiency, and Renewable Energy (2022), Fact of the Week #1230, https://www.energy.gov/eere/vehicles/articles/fotw-1230-march-21-2022-more-half-all-daily-trips-were-less-three-miles-2021.
U.S. Department of Housing and Urban Development, (2016). Creating Walkable and Bikeable Communities. https://www.huduser.gov/portal/publications/Creating-Walkable-Bikeable-Communities.html
U.S. Department of Transportation, (2010). Report to Congress: Transportation’s Role in Reducing U.S. Greenhouse Gas Emissions, Volume 1: Synthesis Report. https://rosap.ntl.bts.gov/view/dot/17789
Victoria Transport Policy Institute. (2023, October 6). “Community Cohesion as a Transport Planning Objective”. https://www.vtpi.org/cohesion.pdf
Williams, McHale, Chow. School of Medicine, University of St Andrews. Final report on loneliness and transport systematic review. https://www.sustrans.org.uk/media/11359/sustrans-loneliness-and-transport-systematic-review-final-report-21-06-30.pdf
For more information visit the DOT Climate Change Center, https://www.transportation.gov/priorities/climate-and-sustainability/dot-climate-change-center